
For those tracking the evolution of Android, it is evident that the future of the Android based ecosystem goes far beyond just phones and tablets. The OS is already making its way into a host of other smart devices, like Google Glass for example, in a movement toward what’s being called “the internet of things” or IoT. Developing a new OEM product based on Android as an embedded OS makes a lot of sense compared to say, only using Linux as we have covered before. However, getting Android to actually work effectively on diverse platforms is quite challenging. While phones and tablets are getting very powerful (with quad core processors and 2+GB RAM having become the de facto standard) this is certainly not the case with many other IoT devices where due to cost margins, the need of the day is still lower powered CPUs and lesser RAM (as RAM is an expensive part of any device BOM). While there are many mechanisms to reduce Android footprint and reduce memory overhead (such as headless Android mode, low memory Android configurations, etc.) ensuring that the application code also effectively uses available memory is important. This article covers best practices for memory usage.

There are two kinds of memories for Android: Clean RAM and Dirty RAM.
Unlike PCs, Android does not offer swap space for memory, however it does use paging and memory-mapping. Any files or resources which are present on the disk, such as code, are kept in mmap’ed pages. Android knows these pages can be recovered from the disk, so they can be paged out if the system needs memory somewhere else.
Dirty RAM is the memory that cannot be paged out. It can be expensive, especially when running in a background process. Most of the memory in a running application is dirty memory and this is the one you should watch out for.
In order to optimize the memory usage, Android tries to share some framework resources or common classes in memory across processes. So whenever a device boots up, a process called zygote loads the common framework code. Every new application process is then forked from the zygote process so it is able to access all the shared RAM pages loaded by it. While investigating an application’s RAM usage, it is important to keep shared memory usage in mind since we should only be looking at the private dirty memory that is being used by our application. This is reflected by USS (unique set size) and PSS (proportional set size) in ‘meminfo.’
Another important thing to keep in mind when investigating opportunities for memory optimization is that Android divides the application processes based on running vs cached processes. A running process is the foremost application running on the device or an application with a service running actively in the background. All other launched applications will go into the list of cached processes to allow for easier and faster switching between applications. For example, if an application is launched and then the user presses the ‘Home’ button, then that application’s process will be added in the list of cached processes, that is if it does not have a running service. Be aware that the system will kill one or more cached processes if it needs more memory for any running process. Cached processes can be killed in LRU (least recently used) order. However there are some other options also, like killing whichever cached process will give the maximum memory gain for the system.
Every application on Android has a maximum heap size limit (varies for each device). You can check the getMemoryClass() API of ActivityManager service, it will tell you the maximum heap size available for any application on a device. Most devices running Android 2.3 or later will return this size as 24MB or higher. For example, the size on a Galaxy S3 is 64MB, whereas on a Nexus5 device, it is 192MB. Android will always start an application process with an average heap size and will then grow it up to the maximum limit on that device for an app. If an application reaches the maximum heap size and needs to allocate more memory, the system will throw an OutOfMemoryError.
So what can you do to keep your system from running out of memory? Read on for some general guidelines for improving the memory usage and overall performance of Android.
The basic rule of thumb here is that garbage collection is not free. The more objects an application allocates, the more frequently garbage collector will be forced to run – which eats up resources needed to boost user experience and responsiveness. Temporary objects can also hurt. A large number of small allocations can also cause heap fragmentation.
For Example:
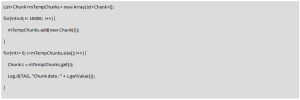
In the second loop of the code snippet above, we are creating a new chunk object for each iteration of the loop. So it will essentially create 10,000 objects of type ‘Chunk’ and occupy a lot of memory. Imagine, if we have just missed the routine GC cycle before creating these objects, then these objects would lay around until next GC.
The same code can be written like the version below, instead:
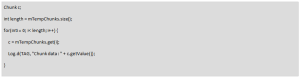
Just one object!
Another Example:
Try to reuse the same object when passing through functions, like below:
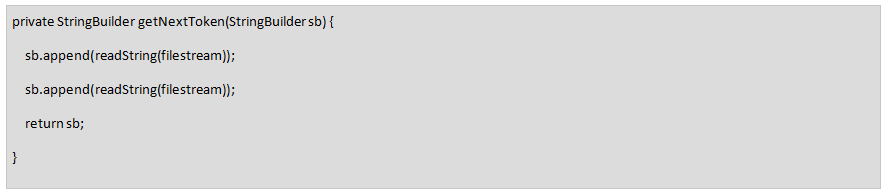
Notice how the string is appended to same StringBuilder object directly without creating any short term temporary objects for String and StringBuilder.
It helps to know the cost and overhead of language constructs we are using.
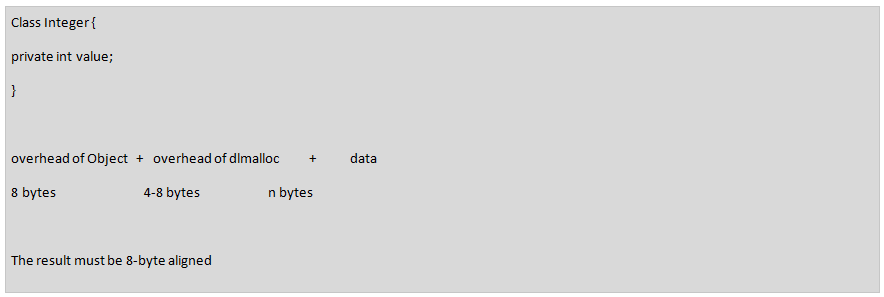
For example:
An Object with just one int variable takes 16 bytes at minimum in Android:
HashMap:
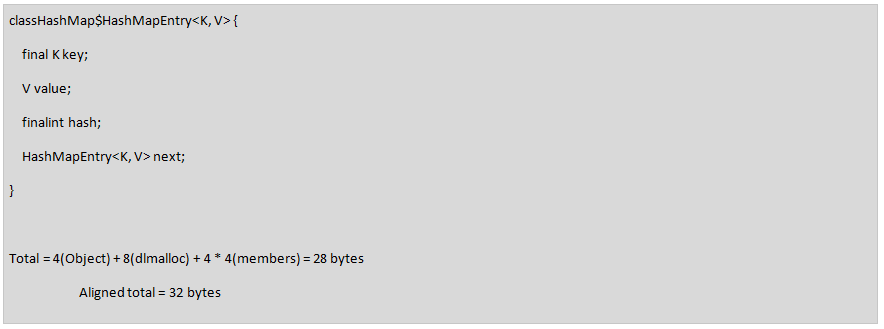
So, every entry in a HashMap would occupy 32 bytes.
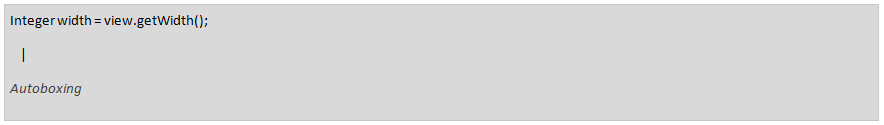
As mentioned above, since an “Integer” boxed object occupies 4 times as much memory as primitive “int,” we should always try to use primitive types where we can. Similarly, a Boolean boxed object occupies much more memory than primitive boolean type. In the example below, the API call returns a primitive “int” value but we have assigned this value to an Integer object. This assignment will perform an autoboxing operation from int to Integer object. For a single call, this may not matter much. However, if we are using it frequently, for example in an inner loop, it might occupy a lot of memory unnecessarily.
Integer (16 bytes)int(4 bytes)
Boolean(16 bytes)boolean(4 bytes)
vs//even better!
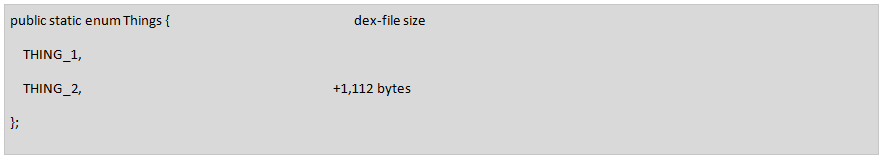
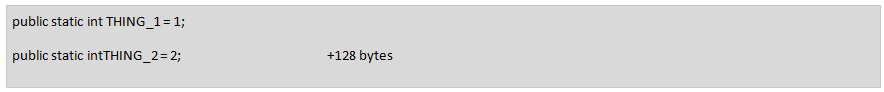
Plain and simple – always avoid using enums on Android. Instead, use “static final” variables for constants. Enums usually require more than twice as much memory as static constants.
vs.
Every class in Java, including anonymous inner classes which create an object and writes accessor methods internally, uses about 500 bytes of code.
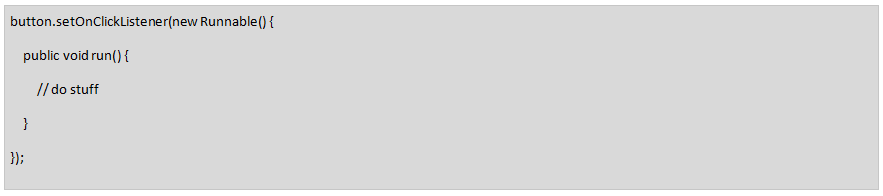
So, these kinds of listeners should be unregistered as soon as they are not needed.
In general, writing code with multiple layers of abstraction is considered good programming practice for object-oriented languages. However, the more code that is written, the more execution time and memory it is going to take. So, try not to overdo the layers. Only use abstractions where they provide a significant benefit. For example, in cases where writing a library to be used by other applications, it makes sense to use abstractions to expose only certain areas of functionality.
Services are useful for running operations in the background, but they are very expensive. You should never keep a service running unless absolutely required. The best way to automatically manage service lifecycle is to use an IntentService, which will finish itself after its work is done. For other services, it’s the application developer’s responsibility to make sure that stopService or stopSelf is being called after work is done.
When the user navigates to a different activity, release the resources associated with that activity in onPause and onStop callbacks. These resources are generally a network or database connection, a broadcast receiver, etc.
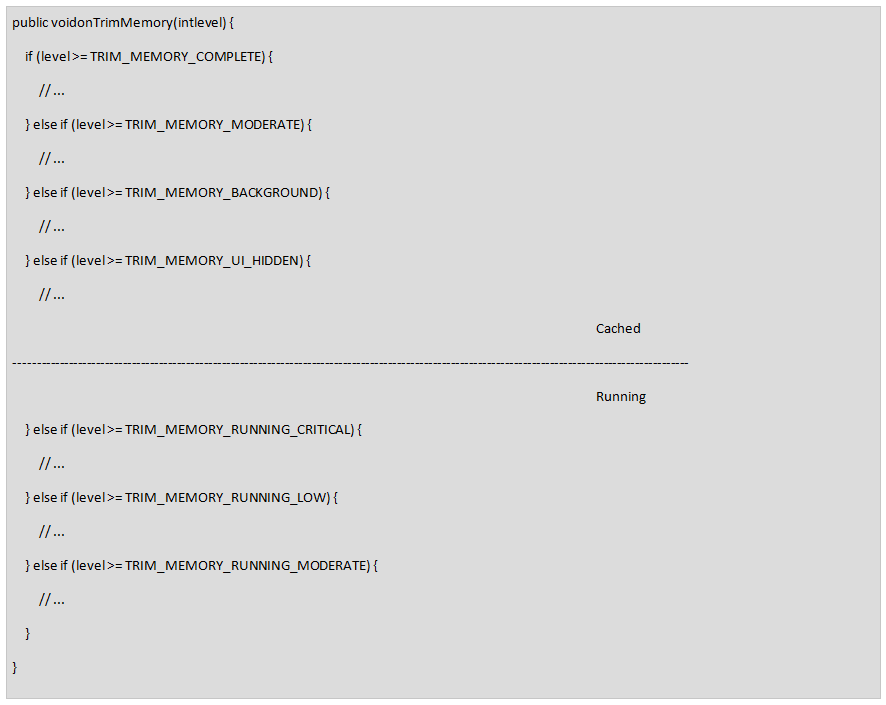
If the user navigates to a different application and all the UI components of the app are hidden, the app receives onTrimMemory() callback in all activities if Android system needs to kill any cached process to reclaim some memory for a running process. Listen for the TRIM_MEMORY_UI_HIDDEN level and release the UI resources here. For example, textviews, imageviews, etc.
Bitmaps are often the largest RAM user in an application. A bitmap loaded in memory takes much more RAM than the size of the image we see on filesystem because:
bitmap size = width * height * depth (usually 4 bytes)
Keeping it in mind, bitmap should be loaded in RAM only at the size and resolution of the current device’s screen. So, we should scale it down if the original bitmap is at higher resolution. On Android 2.3.3 and lower, the backing pixel data for a bitmap was stored in native memory, and there was a need to write finalizers in Java code to free this native memory allocation. Therefore, it used to take more than one GC cycle to free bitmap memory. Hence it was recommended to use recycle on bitmaps after using them to free the memory as soon as possible.
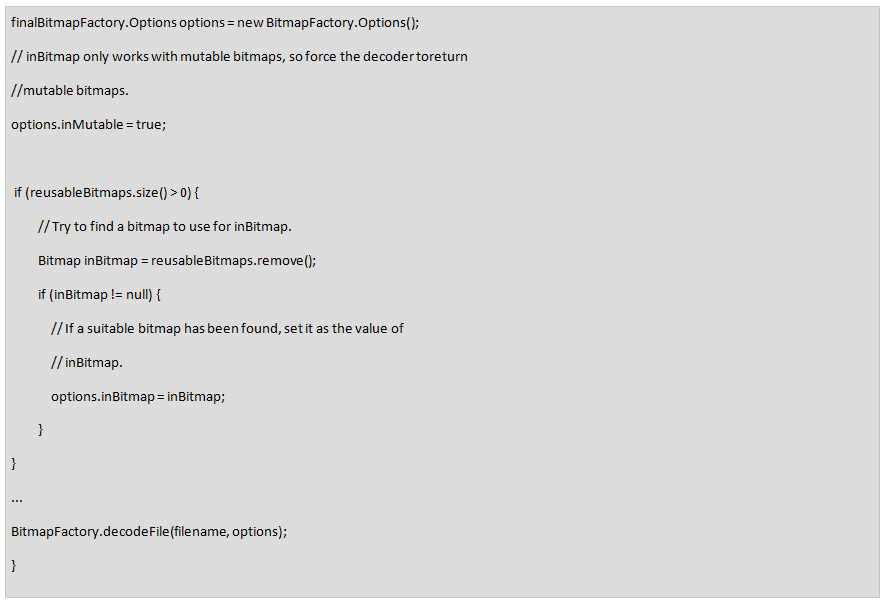
As of Android 3.0 (API level 11) however, the pixel data is stored on the Dalvik heap along with the associated bitmap. So there is no need to call recycle(). But it is still useful to optimize the large amount of memory used by bitmap, and we should try to reuse bitmaps whenever possible. API level 11 introduces the BitmapFactory.Options.inBitmap field. If this option is set, decode methods of BitmapFactory that take the Options object will attempt to reuse an existing bitmap when loading content.
Android has provided a few optimized data containers in SDK and support libraries, such as SparseArray, SparseBooleanArray, and ArrayMap. These containers can be a replacement for Hashmap where the keys are of primitive type like int, Boolean, and so on. Since HashMap needs an Integer object for storing ints, it occupies a lot more memory than is actually needed, especially if we have large number of entries in our map. ArrayMap also consumes less memory, however it is slower in access than HashMap, so it should be only used when working with smaller number of elements, like < 100.
Here are some examples of optimized data containers which we can use as replacement for their HashMap equivalents:
| HashMap | Array Class |
|---|---|
| <Integer, Object> | SparseArray |
| <Integer, Boolean> | SparseBooleanArray |
| <Integer, Integer> | SparseIntArray |
| <Integer, Long> | SparseLongArray |
| <Long, Object> | LongSparseArray |
Use raw arrays, like int[], in performance-critical sections of the code or where we are working with hundreds of thousands of elements at a time, if possible.
The ProGuard tool shrinks, optimizes, and obfuscates the code by removing unused code and renaming classes, fields and methods with semantically obscure names. ProGuard can make the code more compact, requiring fewer RAM pages to be mapped. But you should be aware of how ProGuard works before using it in the application. For example, by default, ProGuard will strip out native JNI functions, dynamically loaded classes or methods, and code which is part of some library internally referenced by another library in the project. So, it is important to configure ProGuard config file to add rules for keeping all the required classes and methods in the project.
While preparing a release build of the application, it is always important to run the ZipAlign tool on the APK to have it re-aligned. This is necessary in order to maximize our static code and resources to be mmapped by Android. Eclipse probably already does that automatically, however we should take care if we are building the APKs on our own using Ant.
To recap, some general performance tips for memory optimization:

To analyze an application’s memory usage on Android, there are several memory profiling tools available. The Android SDK provides two main ways of profiling the memory usage of an app: the Allocation Tracker tab in DDMS, and heap dumps. The Allocation Tracker is useful when we want to get a sense of what kinds of allocations are happening over a given time period, but it doesn’t provide any information about the overall state of the application’s heap.
To collect a heap dump:
Note – DDMS version integrated into Eclipse does hprof conversion automatically, so this step is not required.
To analyze a heap dump, we can use standard tools like Eclipse Memory Analyzer(MAT) or jhat.
When analyzing the heap dump, look for memory leaks caused by:
To observe how an application is divided between different types of RAM, we can use the following adb command:
adb shell dumpsys meminfo <package_name>
This command lists all the current allocations of an application, measured in kilobytes. The important details are the memory used by USS (Private Dirty + Private Clean) and PSS total. It will also show the number of activities currently running, number of view objects allocated and binder objects shared between processes.
Kitkat (4.4) introduced a new service called Procstats to help better understand the memory usage on a device. There is a UI screen found under the Developer Options menu so that you can look at the memory usage by all applications. To run Procstats from command line:
adb shell dumpsys procstats <package_name>
(Do you find this article interesting? You may want to check out our Embedded Android pages to read more about what we do in this space.)